
Part 1: The common way: Profitability
Traders and investors alike, often mistakenly base the success of their portfolios or strategies on returns alone. There is a mix of return and risk factors that should be looked at together to get the full picture. At CLEO.one we provide several proven metrics for measuring your returns since it is the key to objective comparison and mastering the strategy game.
There are several different ways to calculate return on investment. Each approach looks at different factors like initial investment, cash flow differences and number of years and combining them might give a better perspective.
We are going to consider four ways of measuring returns and look at some major implications when it comes to measuring trading success. Depending on factors that you might want to consider when evaluating your trading strategy, you will find that one method or another is preferable.
These are some of the most frequently used returns metrics available to traders and investors:
- ROR
- CAGR
- TWR
- MWR
Let’s take a look at each of them in detail:
Rate of Return (ROR)
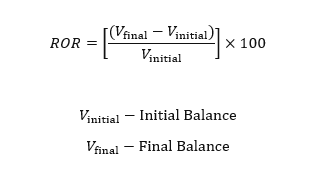
A rate of return (RoR) is the net gain or loss of an investment over a specified time period, expressed as a percentage of the investment’s initial cost. It is used to measure the profit or loss of an investment over time. Although it is the most popular method, it has serious limitations and should not be looked at in isolation when evaluating the performance of the strategy.
The formula for ROR is:
What are the implications of using ROR?
- Note that regular rate of return describes the gain or loss, expressed in a percentage, of an investment over an arbitrary time period
- Additional inflows and outflows are not reflected in the ROR results
- Time factor is not specified in measuring ROR
Therefore, when your ROR shows 50% it’s not necessary that impressive over the duration of 50 years. Same applies to increase caused by the inflow of cash. If you are trying to compare two different strategies that were running over different time periods and had variances in cash flows using ROR would not produce an apple to apple comparison.
Compounded Annual Growth Rate (CAGR)
Compounded Annual Growth Rate (CAGR) shows the geometric average amount of money earned over a period of time if the annual return was compounded.
The formula for CAGR is:
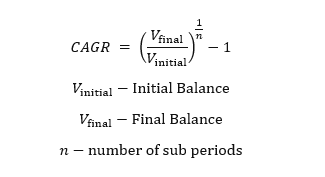
Sub periods value here is defined in number of years. When it comes to calculating Annualized return in CLEO.one the following formula is used:
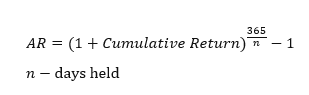
What are the implications of using Annualized Return?
- Ability to compare returns of different assets owned for different lengths of time
- The ultimate growth check metric for strategies and investments that extend over longer period of time
- Annualized return is used to determine how effective a strategy or investment has been in relation to similar investments or strategies available.
Therefore, if annualized return rate of strategy A is 25%, which is higher than that of strategy B (13%) that gives you a pretty good indication of a strategy’s performance over a specific period. While it comes in handy it you compare performance over time alone, it can be tricky to determine the effect of deposits you make over time.
Time-Weighted Rate of Return (TWRR)
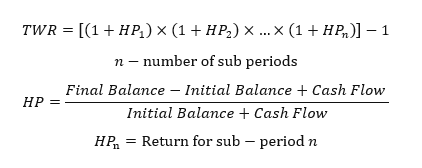
Time-Weighted Rate of Return measures the compound rate of growth in a portfolio or a strategy. It eliminates distortions on growth rates created by withdrawals and deposits of money into the account. In simplest form – it shows how $1 would perform throughout the entire tested / traded period.
TWRR does so by compensating for external flows by splitting the specified period to sub-periods and weighting according to the duration of the sub-period. TWRR would be the best measurement for benchmarking purposes as results are easy to compare.
What are the implications of using TWRR?
- TWRR alone is a great metric to evaluate relative performance of the portfolio/strategy
- It also is better combined with other metrics to see growth over time
- The purest form of calculating return regardless of additional cash flow changes
- TWRR is best used as a benchmark of strategy’s performance, especially in backtesting
With TWRR you can compare to strategy A with strategy B side by side and regardless of cash inflows analyze the performance, same applies to portfolios. If TWRR of strategy A is 45% and strategy B is 10% it will give you an ide . Same applies to increase caused by the inflow of cash. If you are trying to compare two different strategies that were running over different time periods and had variances in cash flows using ROR would not produce an apple to apple comparison.
Money-Weighted Rate of Return (MWRR)
Before we talk about the money-weighted rate of return, it is important to bring up the concept of present value, that states an amount of money today is worth more than that same amount in the future. In other words, money received in the future is not worth as much as an equal amount received today. Money-weighted rate of return is equivalent to internal rate of return (IRR) and measured by finding the rate of return that will set the present values of all cash flows equal to the value of the initial investment.
The formula for the money-weighted return rate is:
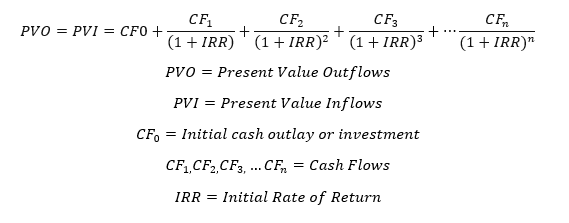
- To calculate IRR using the formula, one would set NPV equal to zero and solve for the discount rate (r), which is the IRR.
- However, because of the nature of the formula, IRR cannot be calculated analytically and must instead be calculated either through trial-and-error or using software programmed to calculate IRR. (Investopedia, 2020)
What are the implications of using MWRR?
- Suitable for tracking the actual cash invested including all types of cash flow
- Indicator of the effect of timing of the cash flows on strategy/portfolio performance
- Not considered the best practice for benchmarking purposes
Let’s look at different ways time and cash flows might have an effect on returns measurement:
- ROR simply looks at increase over specific period thus should only be considered when looking at a period less than a year with no additional cash flows. Once cash inflows and outflows come into play it becomes misleading.
- CAGR is a better fit to evaluate returns over periods longer than one year since it provides the one rate that defines the return for the entire measurement period. CAGR is superior to ROR returns, because it takes into account the fact that values compound over time.
- Let’s say you are trading multiple crypto strategies and need to be able to compare them – you’ll be much better of my using TWRR, rather than ROR
- MWRR assumes all cash flows receive the same rate of return, yet its return can differ substantially from the TWRR. This makes the MWRR less ideal for benchmarking strategies compared to TWRR
- When you are trying to determine how much money was earned with multiple deposits and withdrawals made over time TWR and MWR should both be considered. TWR shows how the returns are compounded over time, while MWR how cash flow affects the returns. This can be better seen on the example below.
Let’s consider 3 scenarios where there is a variance in inflows and outflows to compare TWRR and MWRR:
| No change to balance | Withdrawing effect | Constantly increasing balance | |
| Strategy 1 goes live with $10,000. During the first week, the strategy generates 2% gain, for a balance of $10,200. Next week strategy generates a 6% loss, resulting in a W2 value of $9,588. Strategy 1 then makes 4% gain in week 3 and a 9% gain in week 4 for a total month-end value of $10,869. | Strategy 2 also launches with $10,000. During the first week strategy generates a 2% gain with a balance $10,200. In second week, strategy bears a loss of 6%, and a withdrawal of $2,000, leaving a balance of $7,588 to start Q3. Strategy 2 enjoys a 4% gain in week 3 and a 9% gain in week 4, resulting in a month-end strategy balance at $8,602. | Strategy 3 also starts with an initial balance of $10,000. First week brings a 2% gain and week two produces a loss of 6% bringing the balance to $9,588. Then a balance is increased by additional $2,000 deposit in the same account at the start of week 3. Strategy 3 also enjoys a 4% weekly 3 gain and a 9% weekly 4 gain, resulting in a month-end balance at $13,136. | |
| W1 | $10,000 | $10,000 | $10,000 |
| W2 | – | – | – |
| W3 | – | ($2,000) | +2,000 |
| W4 | – | – | – |
| End value | $10,869 | $8,602 | $13,136 |
| Gain | $869 | $602 | $1,136 |
| TWRR | 8.7% | 8.7% | 8.7% |
| MWRR | 8.7% | 6.33% | 10.84% |
A perfect metric that is universally applied to portfolios and strategies to determine the real return simply doesn’t exist. We can’t stress the importance of data in the trading strategy development process enough, which is why you can CLEO.one strives to provide you with the best indicators for evaluating strategy’s success. For every strategy in CLEO.one, returns are visible under the Result tab and measured using Time-Weighted Rate of Return (TWRR aka TWR) as well as Annualized Return based on Compounded Annual Growth Rate (CAGR). MWRR is already something we consider adding soon.
A note on measuring return of crypto trading strategies
Crypto trading is already complex enough: you need a trading strategy, you need to evaluate the risks, determine profit targets, and beat uncertainty in the environment and noise created by unscrupulous projects.
Be aware of these ways to measure your return. Crypto traders do not have the luxury of accessing these metrics on other platforms due to the lack of such data. Years of successful trading experience confirm that data can add enormous value, but it is not easy to know where data fits.
It should come as no surprise that data is not leveraged by most crypto traders – making it the exact thing that can give you an advantage. Which is exactly why by providing valuable data and tools we are aiming to change that and help crypto markets mature faster. Take advantage of the powerful data provided and check out the returns for yourself whether you are just testing your strategies or trading them live.