Ah, the great crypto bull run of 2017. The time of myths and legends when millionaires were made, and life savings lost. Bitcoin’s glorious run from below $1,000 to $20,000 left observers speechless and HODLers ecstatic…provided they flipped to sellers in time.
Trading platforms, crypto bots and exchanges were not as developed as they are today, but plenty of traders still tried to apply technical analysis to predict price movements. The best and easiest trading strategy at the time was simply holding on to your Bitcoin. From April all the way to the end of December you could have gained 1075.8% by doing absolutely nothing.
Doing nothing can sometimes be the hardest thing. Particularly for traders who already witnessed their holdings multiply. It takes epic psychological fortitude to remain persistent in HODLing.
Is trading better than HODL in crypto? Would you be better off with actively trying to increase your funds or just observe?
Looking at recent price movements in the crypto space we want to put to test top five most popular crypto trading indicators and see how they performed in the crypto bull run of 2017. That should give you an idea if trading or HODLing is better.
The backtested strategies for the 2017 crypto bull run
Disclaimer: This is not an attempt to find the best crypto trading strategy or trading bot for bull runs. It’s simply a thought experiment to challenge some common paradigms and provide ideas on optimizations. The strategies featured below are based on how these indicators are most used, and benefit from look-ahead bias. They don’t include stop losses or take profits. For testing purposes imagine you were basing your entire strategy on just one trading indicator.
All strategies were backtested 01 Apr 2017 – 31 Dec 2017. Holding Bitcoin over the same period, considered the 2017 bull run, would have yielded a 1075.8% return. For comparison’s sake we’re trading using all funds on the account on every trade, which is not advisable in a real-life scenario. The backtested indicators are:
- MACD
- RSI
- Bollinger Bands®
- VWAP
- EMA (50)
- EMA (200)
Here’s what we’ve found:
Trading MACD during the 2017 crypto bull run
MACD is so popular in crypto trading that it makes sense to watch it, just because you know other traders are watching it. Price is supposed to go up when the MACD histogram turns green or crosses up 0. When the histogram turns red or it’s crossing down 0, traders are generally looking to open a short position.
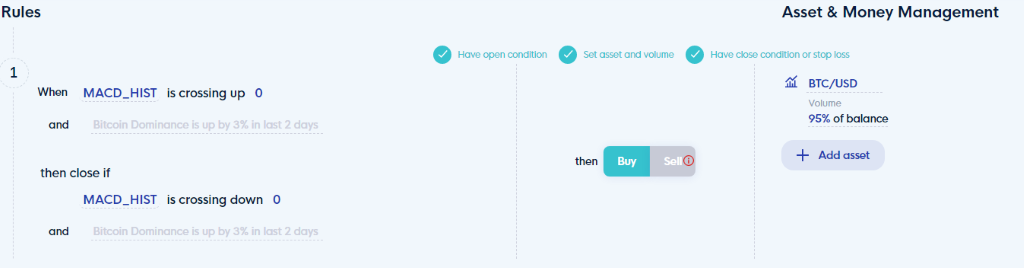
That’s exactly how we set up our backtest. Whenever the histogram turns, we are entering or exiting a position. The results are in:
| Timeframe | Return |
| 1D | +302.33 % |
| 4H | +708.68 % |
| 1H | +658.82 % |
| 30M | +582.38 % |
Even though trading on high timeframes is deemed as good for eliminating noise, this does not apply to MACD in the 2017 crypto bull run. Things were moving fast back then. On all tested timeframes MACD underperformed buy and hold. The daily timeframe yielded “just” +302.33 %, while the same strategy performed twice as well on the 4-hour.
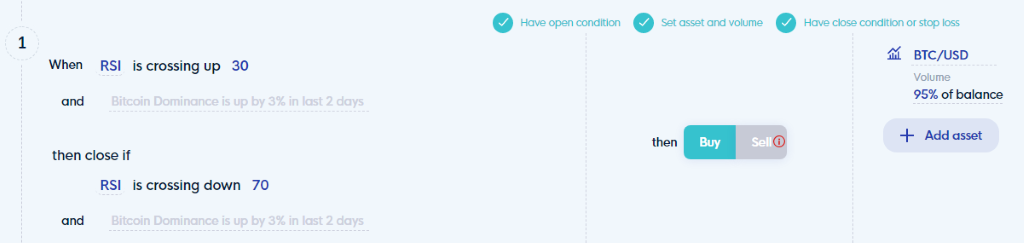
Trading RSI during the 2017 crypto bull run
RSI is another classic indicator and extremely prominent in crypto trading. Applying it is easy: when it’s showing 30 or below the asset is oversold so price should go up as it is reverting to the mean. When it’s above 70 the asset is considered overbought, so price is expected to go down.
RSI’s popularity could probably be attributed to its ease of use. In our test, RSI in isolation lost to both buy and hold and other indicators, particularly on lower timeframes. This is not very surprising as “overbought” was not really a concept that Bitcoin was willing to adhere to at the time.
| Timeframe | Return |
| D1 | +113.76% |
| H4 | +35.94% |
| H1 | +25.42% |
| M30 | +18.42% |
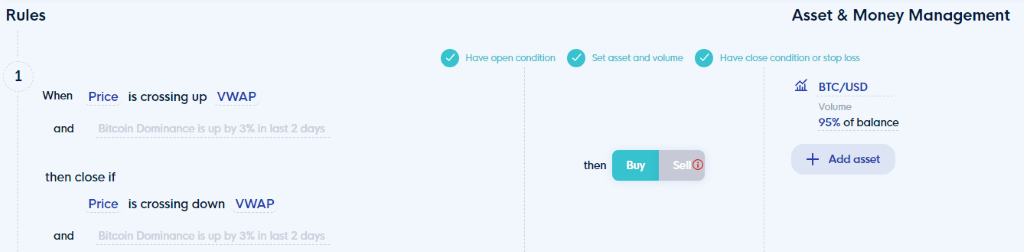
Trading VWAP during the 2017 crypto bull run
VWAP is a popular indicator for stock trading as it does a great job of pinpointing the average volume and value for the asset. Price interaction is like with moving averages: crossing it up is bullish, while crossing it down is bearish.
If you were to use VWAP alone while trading Bitcoin in 2017 you’d rack up some incredible returns but still not beat buy and hold. Again “average” or “mean” is not something Bitcoin liked to obey in its parabolic run.
| Timeframe | Return |
| D1 | +524.02% |
| H4 | +352.57% |
| H1 | +680.9% |
| M30 | +582.38 % |
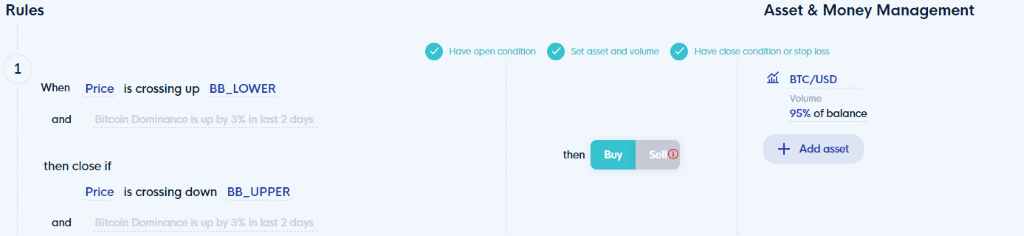
Trading Bollinger Bands® during the 2017 crypto bull run
Bollinger Bands® are a dual measure of trend and volatility. In our trading strategy set up we’re opening a position when price crosses up the bottom band and closing it when price crosses down the higher band.
In a market where the trend was crystal clear and volatility high, Bollinger Bands® did not perform very well. Their utility becomes more pronounced on lower timeframes.
| Timeframe | Return |
| D1 | +66.12% |
| H4 | +134.14% |
| H1 | +176.03% |
| M30 | +115.36% |
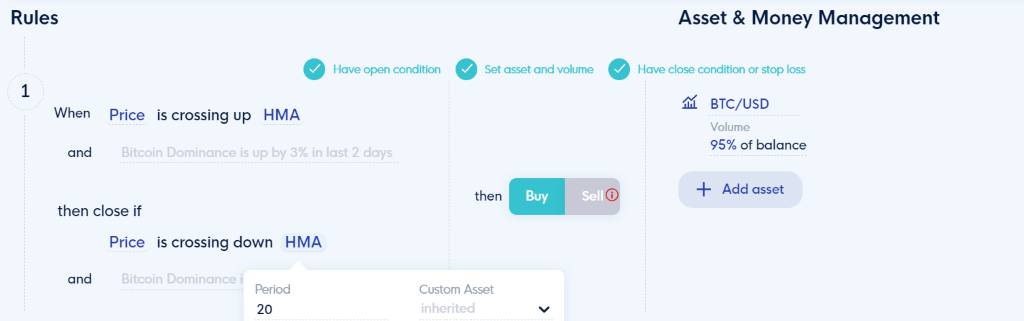
Trading HMA during the 2017 crypto bull run
Up next: moving averages. We’re going to start by looking at Hull Moving Average. It’s meant to be responsive while filtering out noise and can be a great inclusion in your crypto trading strategies. Our strategy is again set on price crossing it up/down to open or close a position. The default period is 20, kept that way fro this test.
While HMA performed quite well and somewhat consistently across timeframes it still comes short to match buy and hold. However out of all the moving averages we tested, HMA gave the best yield.
| Timeframe | Return |
| D1 | +741.72% |
| H4 | +863.83% |
| H1 | +344.5% |
| M30 | +812.78% |
Trading EMA (50) during the 2017 crypto bull run
The 50 EMA is sometimes used as dynamic support or resistance on high time frames. We’ve set it up just like the HMA – when price crosses up/down, we open/close a position. The results were interesting.
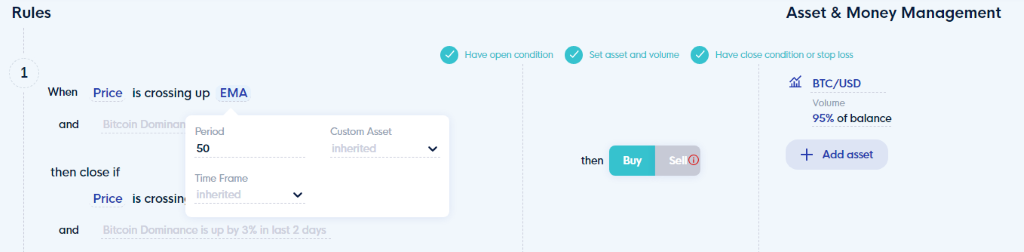
The high timeframe application seems to work well yet trading only with the 50 EMA would have been the one strategy that would have caused a net loss during the 2017 Bitcoin bull run.
| Timeframe | Return |
| D1 | +835.77% |
| H4 | -62.24% |
| H1 | +452.87% |
| M30 | +621.74% |
Trading EMA (200) during the 2017 crypto bull run
Lastly, let’s look at the 200 EMA. Used as an indication if the crypto market is in an upwards or downwards trend, it’s an important moving average to watch. Since it’s a slow-moving average, we expected to see fewer trades and stronger results.
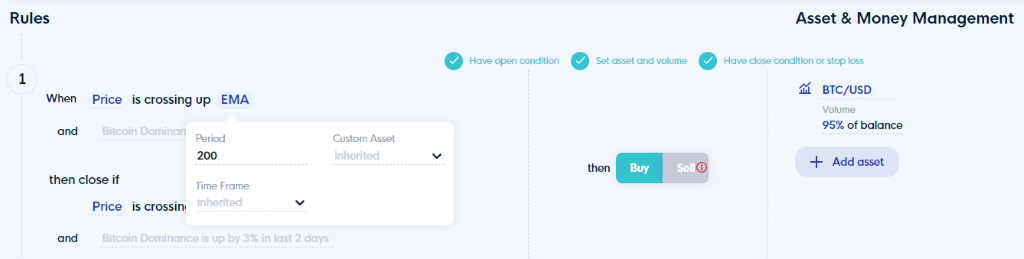
On lower timeframes this strategy performed ok, although not beating buy and hold. On the daily it never opened any trades as price did not interact with the EMA. Yet like the other indicators tested in solitude it should not be the only indicator consider when designing a trading strategy.
| TImeframe | Return |
| D1 | No trades |
| H4 | +460.69% |
| H1 | +593.79% |
| M30 | +575.69% |
How to combine the well performing crypto strategies to beat buy and hold
In preparation for the next bull run it could be quite beneficial to review the results and see what we can improve on.
Improving the basic MACD trading strategy
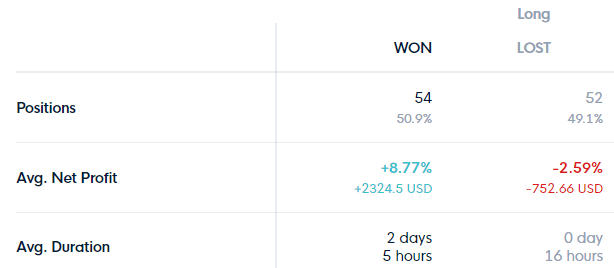
Let’s start with the MACD strategy that returned +708.68 % on the 4-hour time frame. Taking a better look at the statistics of the results we should get an indication of what to try next:
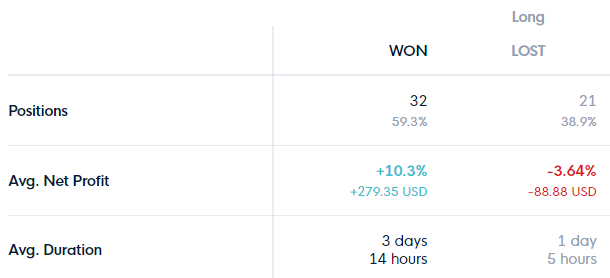
We can see that we are winning more trades than losing and by a significant amount. However, the losing positions are closed quicker than the winning ones. So, we might need to look for a second confirmation on when to close a position:
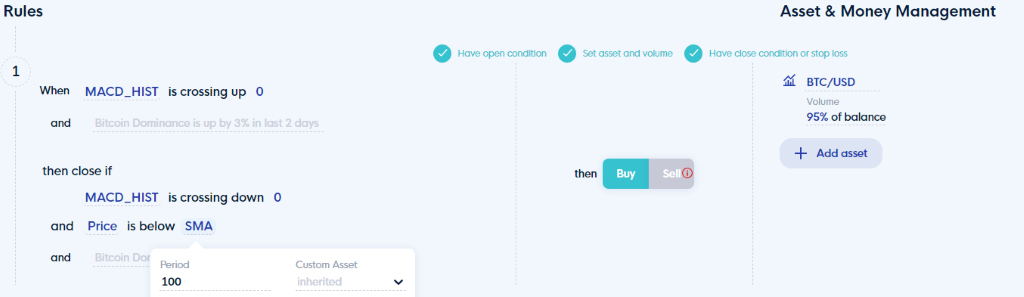
Adding a rule that the MACD histogram needs to be turning red, but at the same time price needs to be below the 100 SMA might help to identify a possible end to the uptrend.
Backtesting our new strategy shows us that this second iteration would have actually beaten buy and hold handsomely:
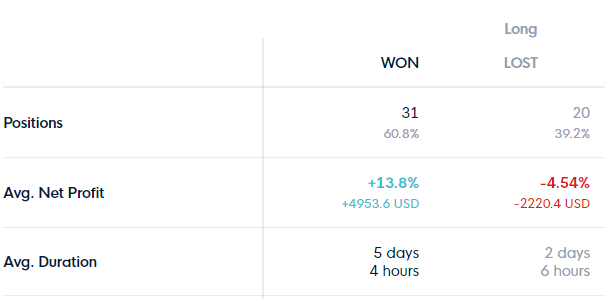
Looking at the statistics in detail, we can see that we dramatically increased the duration of our positions and decreased false signals:
Improving the basic HMA trading strategy
Let’s look at the 4-hour HMA strategy with promising results in a similar way:
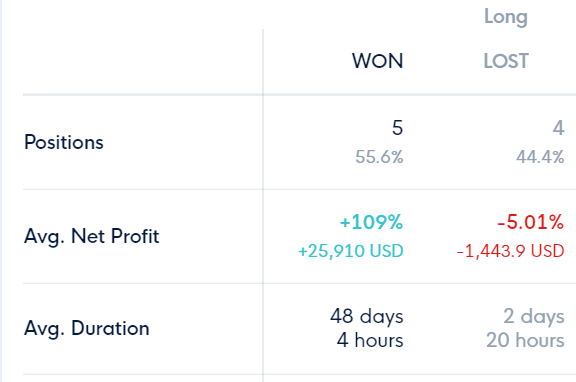
The statistics tell us that losing positions are closed quite rapidly. As we are working with a moving average, we can try a slower version of the HMA (the default length is 20) to see if more breathing space would help the performance of our strategy:
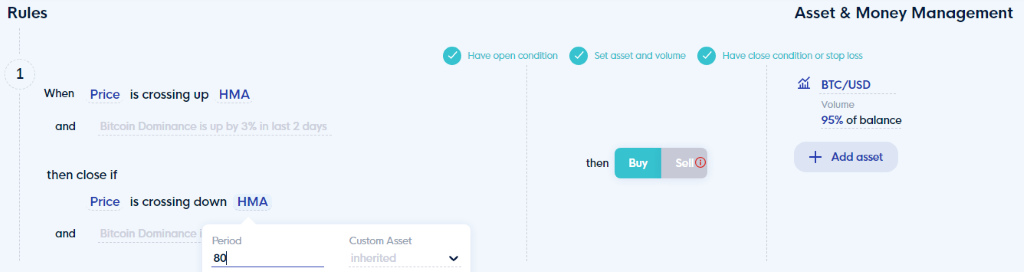
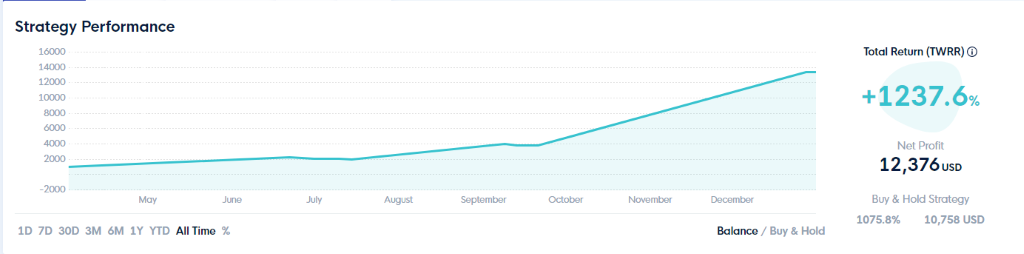
We changed the length of the HMA on the closing condition to 80 so we can again expect a reduction in the number of positions. The backtest was ran on the same period:
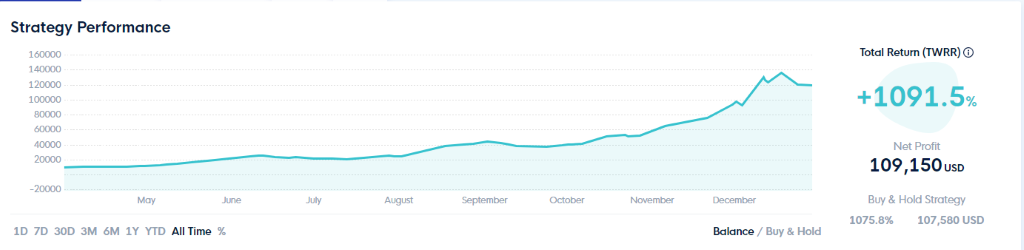
With a return of +1091.5% this modified version is beating buy and hold. Again, we see less positions and less false signals which is ideal:
Conclusion
While it is interesting to explore which indicators performed well in a previous bull run not a single of the top indicators, we looked at can be used as a stand-alone strategy. This is a nice reminder that oscillators levels or moving average crossings do not have to be dogmatic, particularly in exceptional circumstances.
It is indeed possible to beat buy and hold. If you are interested in different approaches and what happens when it is not a bull run Dirk F. Gerritsen, et al., Finance Research Letters, wrote a detailed research paper in 2019 where they evaluate multiple crypto trading strategies across a longer time span and compare them on a few interesting criteria including Sharpe ratio.
One key takeaway from this is that backtesting on multiple timeframes is essential when you want to get to the best version of the strategy. Even if it’s just for your piece of mind, spending extra time on checking your ideas has potential to significantly improve your results – and isn’t it what we’re all after?
Another evident finding is the role of the confirmation indicator. It can be as simple as adding SMA to the mix, while your strategy improves substantially. With solid research, planning and the tools crypto traders have today there is no reason to miss out on the next strong bull market. Better than buy and hold while using solid crypto bots with the same level of executional effort – 0.
Other crypto trading strategies
On more guidance on how to design great trading strategies check out our suggestions in this guide on what to look for and how to create a somewhat safe strategy. Our help center also has simple trading strategies to get you started.
If you want to see backtested versions head to the CLEO.one app where we feature free, already tested strategies. In fact, when you connect a Binance exchange account you can use CLEO.one for free! The account is packed with live trading bots, backtests, paper trading slots, and more! Sign up today and secure your spot.