Finding optimal parameters of technical indicators and not losing everything
If you ever developed an algorithmic trading strategy based on technical analysis, you probably wondered how to set up the parameters of the technical indicators. What if there is a better period for RSI on EUR/USD than 14, which is the default? What if a strategy based on moving average crossover were more profitable if the fast moving average was a bit faster or slower? And more importantly: how am I to tell?
You would have to perform lots of backtests (one for each combination of parameters) and then compare the results. The problem is that there are just too many possible ways to set the indicator parameters, so most of us rely on the default values. These, however, are not necessarily optimal. Can anything be done about that?
Unless you want to try out each combination of parameters manually (trust me: you don’t), you either need to know coding or have an app for automated backtesting that allows you to run hundreds of backtests and pick the strategy with best results. MetaTrader does offer this option but there is an issue with such optimization that would likely result in a net loss for the user rather than profit if he or she tried to trade the optimized strategy. The issue is so-called curve-fitting and it is worth discussing it in more detail since it appears in various forms when dealing with algorithmic trading strategies.
Curve-fitting
Suppose you know future price curve of some asset. Such information would be a gold mine — it would be very easy to trade, you would just go long at the troughs and short at the peaks, using largest leverage possible, and make a fortune. This way the chart of your positions would fit the price curve:
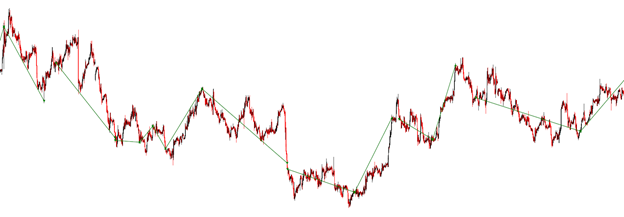
So, it is clear that making huge profits on a price curve that we can know before is easy. And that is precisely the situation in which an algorithm optimizing the parameters finds itself in. Why? Because with the vast number of parameters of indicators used in the trading strategy it is very likely that some combination of parameters will result in such a series of trades that will fit the price curve. It is thus easy for a computer to go through all possible combinations and find the one that performs best on historical data. But there is no guarantee, of course, that such a combination will be optimal on future data as well.
Optimization in MetaTrader 4 runs into this issue. The tester returns backtest results of all searched combinations, so the best performing combinations are so good not because they are robust (i.e. that their performance would generalize into the future too) but rather because they are those that fit the curve well. Optimization in MetaTrader 5 tries to solve this issue by adding the option to run a forward analysis (see next paragraph) but since it still runs many backtests on the testing period, the best combination from the forward analysis will still be good because of curve-fitting rather than robustness. In short, optimization in MetaTrader 4 does not provide the user with the kind of information he or she would need to make a good decision about parameter settings. And while optimization in MetaTrader 5 does provide the needed information, it is difficult to use it for an informed decision unless you are data scientist experienced in statistical modelling. If you relied just on the results of the forward analysis, you would likely lose money too.
Robust optimization with AI
Can the optimization issue be solved in any way? This is where the principles of machine learning help, specifically the custom of dividing data into a training set and a testing set. It’s a simple and crucial principle stating that the result of some algorithmic optimization or learning must be evaluated on other data than those the algorithm used for training (in our case: finding the best parameters). Only when the performance on testing data is nearly as good as the performance on training data do we say that the optimization is robust. In our use-case, for example, it would mean to run parameter optimization on EUR/USD prices in year 2017 and then look how such optimized strategy would have performed in 2018. For if it were the case that the optimization just over-fitted the curve of 2017, the optimized strategy would probably perform poorly in 2018.
And this brings us to a new problem: how to optimize a strategy on historical data in such a way that it will likely perform well on future data too? Answer to this is, of course, the holy grail of algorithmic trading and the highly treasured secret of successful hedge funds.
At CLEO.one we applied other machine learning techniques to solve this problem as well as possible so that users can concentrate on developing the logic of the strategy rather than on looking for the best combination of parameters. As a result, you can now optimize your strategy with one click on our platform and still be sure you will avoid all the problems described above. How do we do it? Stay tuned to find out more about CLEO.one Optimizer, us, and our mission.
Go to CLEO.one and try it out yourself.
Authors: CLEO.one Data Science Team